Data visualization of instagram images by users
2016-05-13the assignment was make something similar to phototrails.net with an instagram dataset of st.petersburg. The visualizations show users that are most active in terms of numbers of photo and how much they move around in the city. The slideshow at the bottom show each weekday separately. (details to come)
Color represents time of day:

Color represents day of the week:
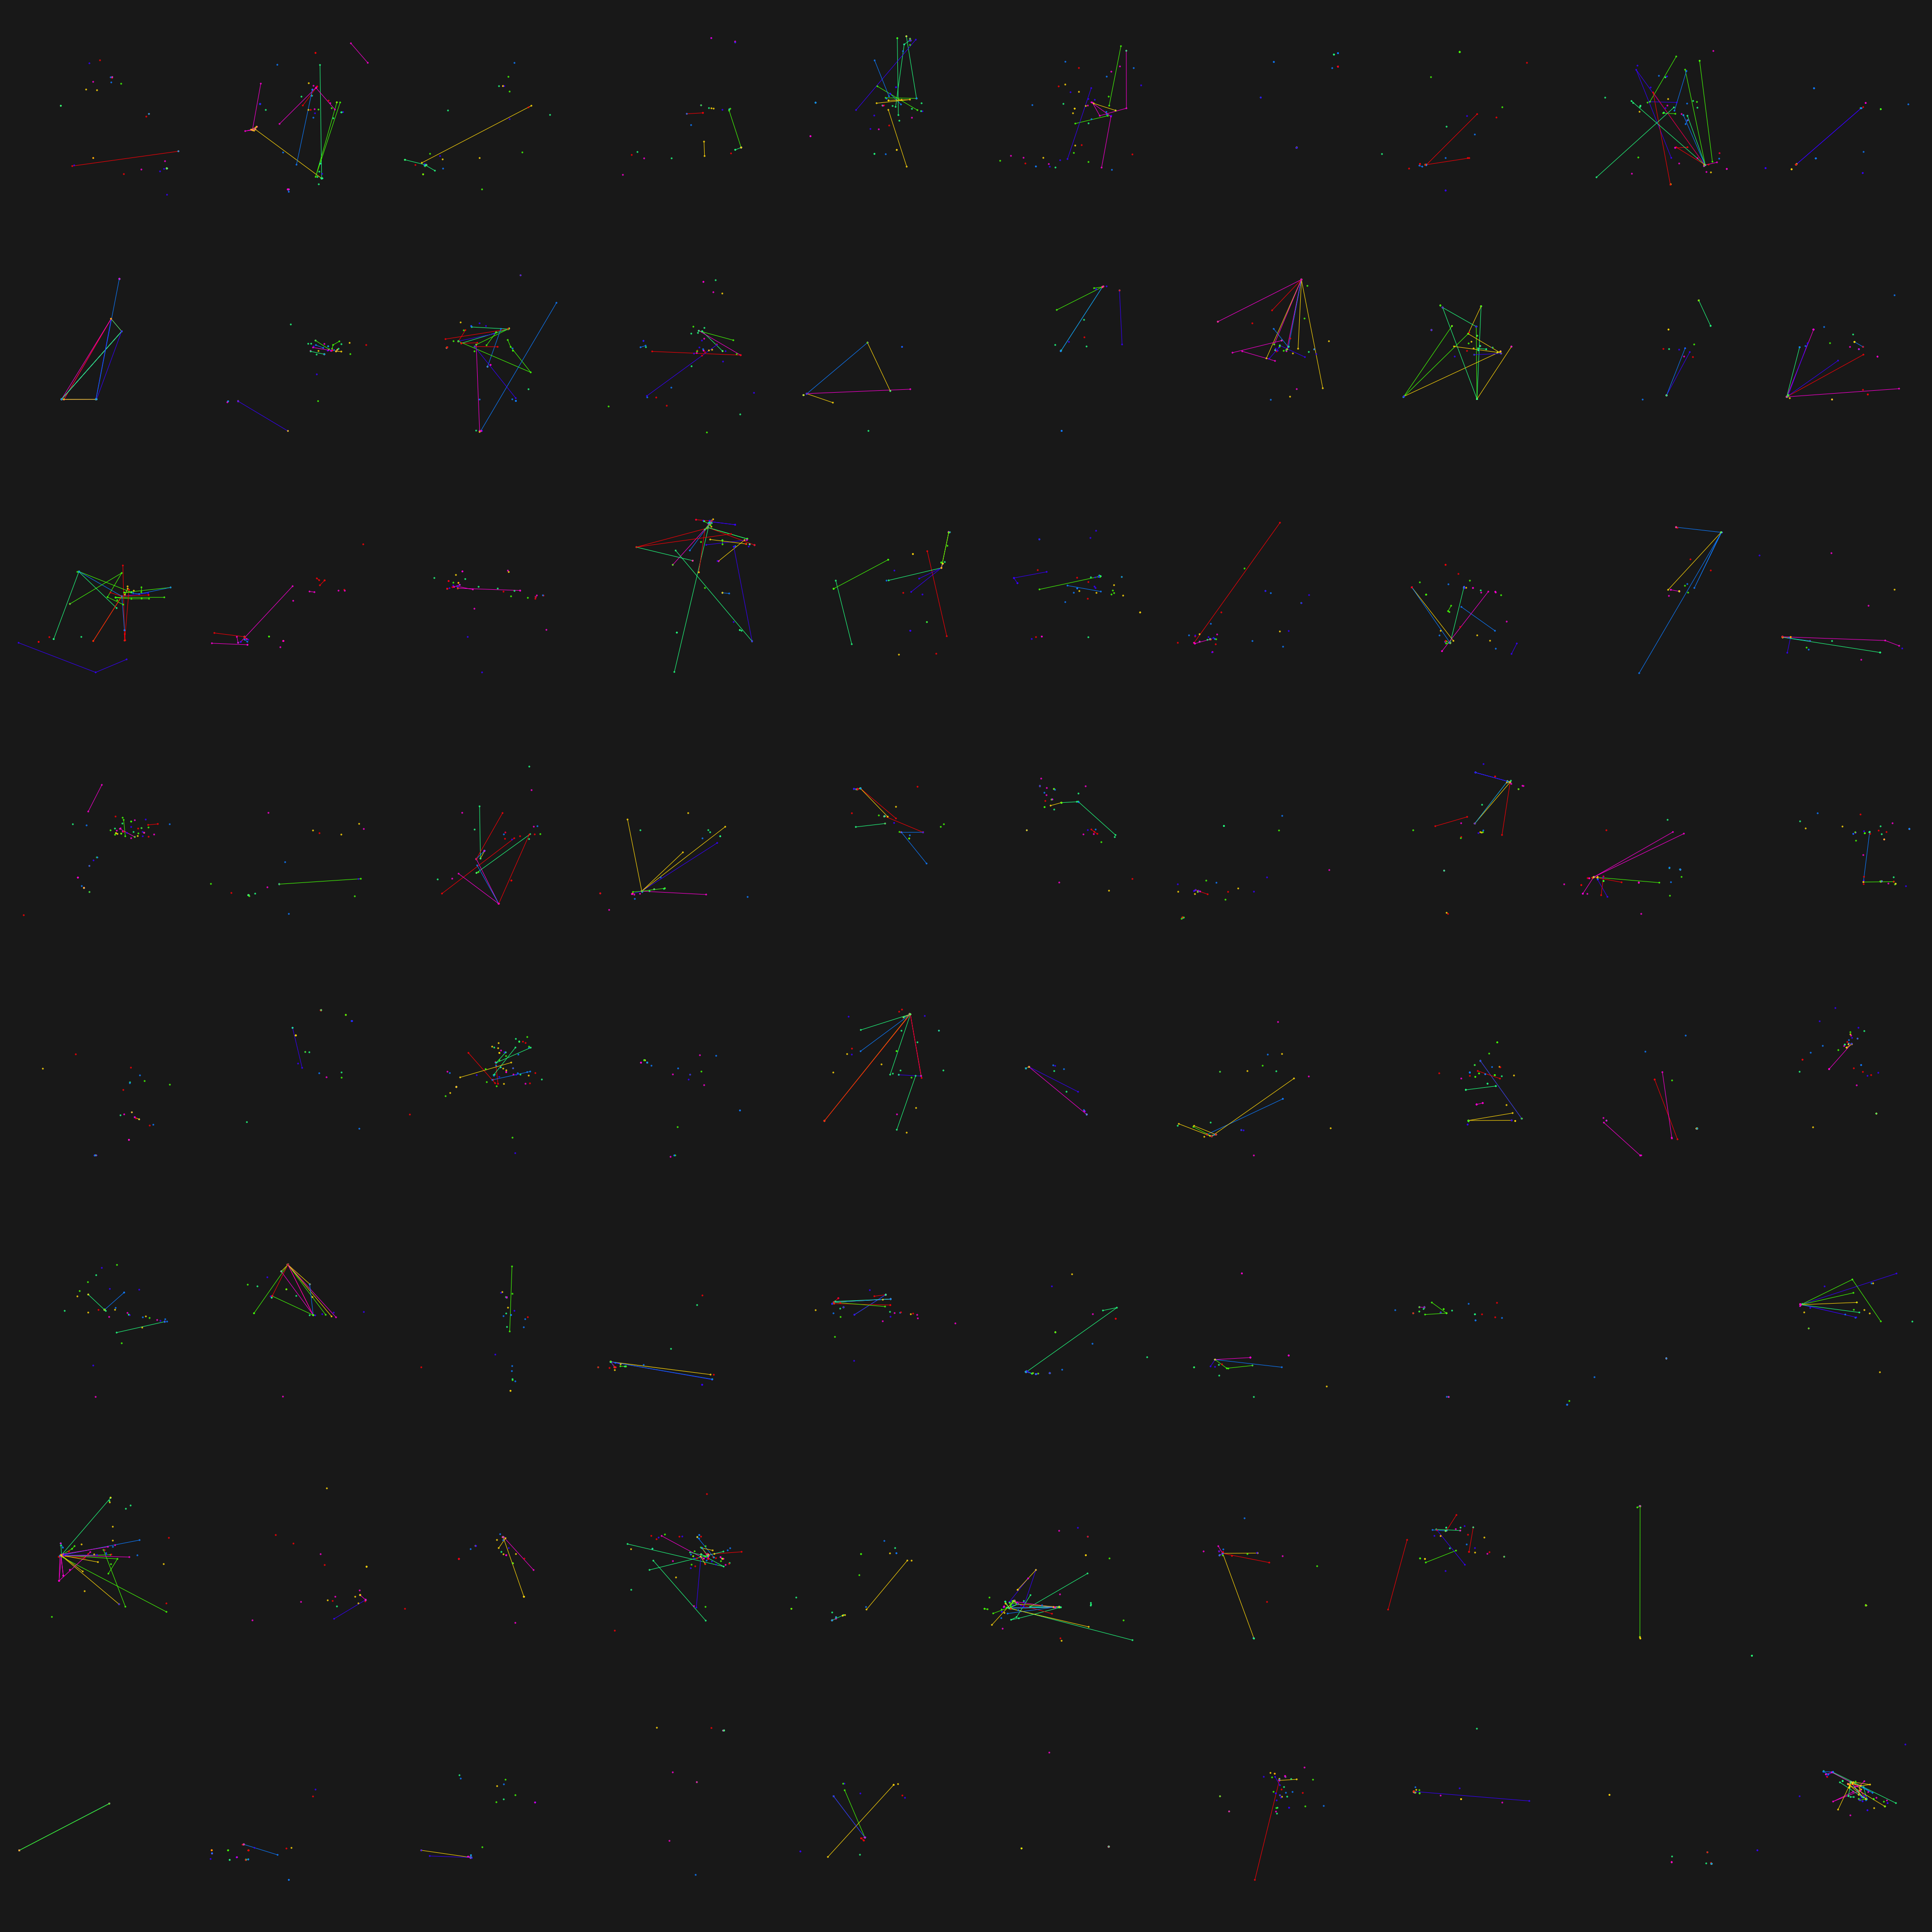
Sunday
